In short
BMI is your weight divided by your height squared. People of South Asian and some other backgrounds carry more risk at a lower BMI, so NICE and the NHS draw lower lines at 23 and 27.5. A waist under half your height is a simple second check.
On your report
HbA1c, Fasting Glucose, Triglycerides, HDL Cholesterol +3 more
On this page
01
How BMI is calculated
Body mass index, or BMI, is your weight in kilograms divided by your height in metres squared. The NHS gives a worked example: someone who weighs 70 kg and is 1.70 m tall first squares their height, 1.70 x 1.70 = 2.89, then divides their weight by that, 70 ÷ 2.89 = 24.22. The result is shown to one decimal place, so 24.2.
You need only a tape or wall chart for height and a reliable scale. The NHS adult calculator is for people aged 18 and over. It is not meant for anyone who is pregnant, has or may have an eating disorder, or has a condition that affects their height. Children and teenagers aged 2 to 17 need a separate calculator that takes age into account.
02
The standard bands
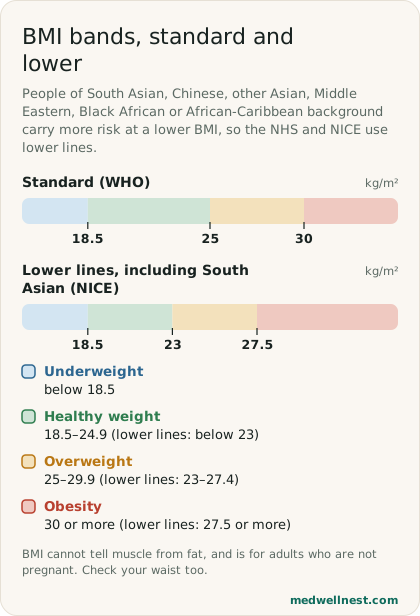
The World Health Organization defines overweight in adults as a BMI of 25 or more, and obesity as a BMI of 30 or more. Below 18.5 is underweight.
NICE, a national guideline body, spells the bands out: a healthy weight is 18.5 to 24.9, overweight is 25 to 29.9, obesity class 1 is 30 to 34.9, class 2 is 35 to 39.9, and class 3 is 40 or more. NICE also asks doctors to use judgement within the healthy band, because a person with a healthy BMI can still carry too much fat around the middle.
03
Lower lines for South Asian and some other backgrounds
NICE says people with a South Asian, Chinese, other Asian, Middle Eastern, Black African or African-Caribbean background are prone to fat around the middle, and their risk to the heart and metabolism starts at a lower BMI. For these groups it uses lower lines: overweight is a BMI of 23 to 27.4, and obesity is 27.5 or above. Obesity classes 2 and 3 are usually found by taking 2.5 off the standard thresholds. The NHS obesity page uses the same 23 and 27.5 lines.
It helps to be precise about where these numbers come from. A WHO expert consultation published in 2004 found that the BMI at which risk rises varies from 22 to 25 in different Asian populations, and did not try to set separate cut-offs for each. It agreed that the standard WHO cut-offs should stay as the international classification, and identified 23, 27.5, 32.5 and 37.5 as further points for public health action, leaving each country to decide how to use them. So 23 and 27.5 are WHO action points; the NICE and NHS bands are what turn them into overweight and obesity lines.
Look back at the NHS example. A BMI of 24.2 is a healthy weight on the standard bands, but on the lower lines it falls in the overweight range. If your family roots are South Asian, the lower lines are the ones NICE and the NHS would apply to you.
04
What BMI cannot tell you
BMI cannot tell muscle from fat. The NHS points out that someone with a lot of muscle may be classed as overweight or obese despite having low body fat, and NICE asks doctors to interpret BMI with caution in people with high muscle mass.
It also does not show where fat sits. NICE notes that BMI is not a direct measure of fat around the middle, the kind NICE links to heart and metabolic risk. In people aged 65 and over, NICE advises caution too, taking other health conditions into account and the possibility that a slightly higher BMI may be protective in later life. That is why a waist measurement is the natural next step.
05
The waist-to-height check
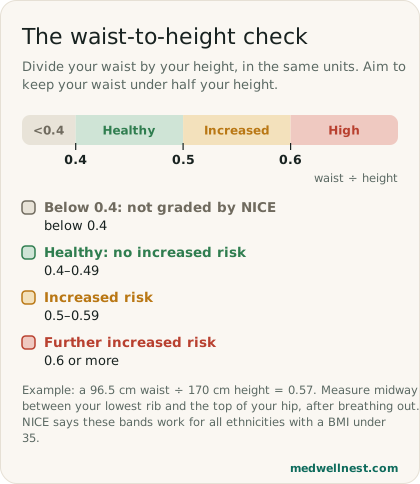
NICE describes how to measure. Find the bottom of your ribs and the top of your hips. Wrap a tape around your waist midway between the two, which is usually just above the belly button, breathe out naturally, and then read the tape. Divide your waist by your height, using the same units for both.
NICE grades the result: 0.4 to 0.49 is healthy with no increased risk, 0.5 to 0.59 means increased risk, and 0.6 or more means further increased risk. Its worked example is a 96.5 cm waist divided by a 170 cm height, which gives 0.57. The simple message from both NICE and the NHS is to keep your waist to less than half your height, so a 160 cm person would aim for a waist under 80 cm.
NICE says these bands can be used for adults of all ethnicities and both sexes with a BMI under 35, including people with a lot of muscle. That makes this one of the few measures that works the same way whatever your background.
06
About the 94 cm and 80 cm figures, and what to do next
You may see waist limits of 94 cm for men and 80 cm for women described as WHO guidance. A 2008 WHO expert report does print them, along with 102 cm and 88 cm for substantially increased risk. But the same report says the figures, which came from a single European population sample, were an example only and not WHO recommendations. NICE's own waist check is the waist-to-height ratio in the section above, which does not depend on those figures.
The NHS suggests seeing a doctor if your BMI is in the overweight or obese range and you want help, your waist is more than half your height, you have prediabetes, diabetes, high blood pressure, high cholesterol, joint pain, sleep apnoea or heart disease, or obesity runs in your family. It also notes that losing even 5 to 10% of your body weight can improve your health. Blood tests such as HbA1c and a lipid profile show whether the extra weight is already affecting your sugar and cholesterol.
Values mentioned in this story
Each one opens a visual guide with its normal range and what moves it — upload a report and we place your own numbers on the same scale.
Sources
- Calculate your body mass index (BMI) for adults — NHSnhs.uk
- Overweight and obesity — NHSnhs.uk
- NG246: Identifying and assessing overweight, obesity and central adiposity — NICEnice.org.uk
- Appropriate body-mass index for Asian populations (WHO Expert Consultation, Lancet 2004)pubmed.ncbi.nlm.nih.gov
- Waist circumference and waist-hip ratio: report of a WHO expert consultation (2008)iris.who.int
Share this story
Curious where your own values stand?
Two minutes from upload to a full visual picture. Free to analyze.