In short
The lining of the womb thickens and sheds every cycle, so a normal number depends on the day of the scan. After menopause the lining should be thin, and any bleeding needs checking whatever the scan shows.
On your report
Estradiol, FSH (Follicle-Stimulating Hormone), Hemoglobin
On this page
01
What the number on your scan measures
The endometrium is the lining of the womb. On a vaginal ultrasound it shows as a bright stripe, and the report gives its thickness in millimetres. ACOG describes the measurement as the maximum thickness from front to back, taken at the thickest point on a lengthwise view of the uterus. Any fluid inside the cavity is left out of the number.
The measurement is not always reliable. ACOG lists a tilted uterus, obesity, fibroids, adenomyosis and previous surgery on the uterus as things that can make the lining hard to see and measure. A report that says the lining was not clearly seen is not a normal result; it means another way of looking may be needed.
02
Before menopause, it depends on the day
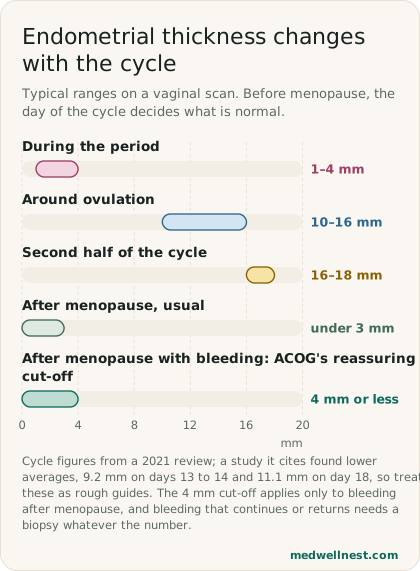
In women who still have periods, the lining changes through the month under the influence of hormones. A 2021 review describes it as a thin line of 1 to 4 mm during a period, reaching about 10 to 16 mm around ovulation, and 16 to 18 mm in the second half of the cycle.
Other data are lower. A multicentre study quoted in the same review found an average of 7 mm on days 1 to 6, 5.4 mm just after the period, 9.2 mm on days 13 to 14 and 11.1 mm on day 18. Treat any single range as a rough guide, and always read the number together with the day of your cycle, which is why you are asked when your last period started.
There is no agreed cut-off at which a lining becomes abnormal before menopause. The review states that the thickness at which women with abnormal bleeding should have a biopsy is yet to be defined, so doctors weigh the number against your symptoms, age and risk factors.
03
After menopause, and the 4 mm rule
Once periods stop, the lining usually becomes thin. The same review describes it as typically under 3 mm on ultrasound.
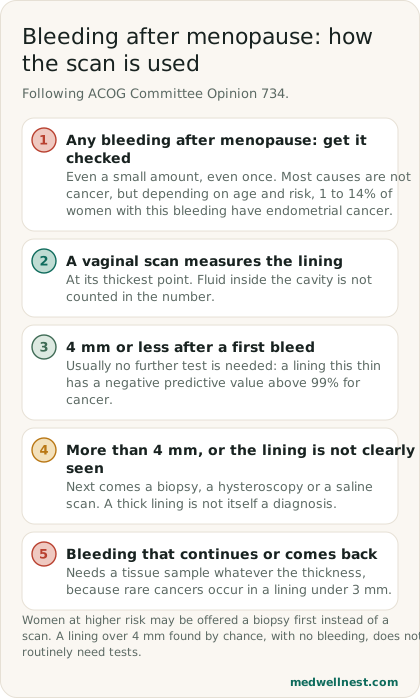
For a woman who has had bleeding after menopause, ACOG says a vaginal scan is a reasonable first test, and that a lining of 4 mm or less has a negative predictive value above 99% for endometrial cancer. In practice, a thin, clearly seen lining after a first episode of bleeding usually means no further test is needed. If the lining is thicker than 4 mm, or cannot be seen clearly, the next step is a tissue sample (endometrial biopsy), a hysteroscopy or a saline scan.
Two limits matter. A thick lining is not itself a diagnosis: polyps and other conditions that are not cancer also thicken it. And a thin lining does not settle everything. ACOG notes that rare cancers can occur in a lining under 3 mm, so bleeding that continues or comes back needs a tissue sample whatever the scan shows. Women at higher risk may be offered a biopsy first instead of a scan.
04
Bleeding after menopause always needs a check
Any bleeding from the vagina after menopause should be checked by a doctor, even if it is only a small amount or has happened only once. The NHS explains that it is usually not serious, but that it can be a sign of cancer, which is easier to treat when found early.
The most common causes are thinning of the vaginal or womb lining due to low oestrogen, polyps, and a thickened lining (endometrial hyperplasia), which can be linked to hormone replacement therapy (HRT), high oestrogen levels or being overweight. ACOG says that, depending on age and risk factors, 1 to 14% of women with postmenopausal bleeding have endometrial cancer, and that bleeding is the first sign in more than 90% of women with this cancer.
This is why guidelines treat the bleeding, not the scan number, as the starting point. ACOG calls for prompt and efficient evaluation, and NICE advises doctors to refer women aged 55 and over with unexplained postmenopausal bleeding, not due to HRT, on a suspected cancer pathway, and to consider the same for women under 55.
05
A thick lining found by chance, or on medicines
Sometimes a scan done for another reason shows a lining over 4 mm in a woman who has had no bleeding. ACOG says this need not routinely trigger tests, although a doctor should consider your own risk factors, and that a vaginal scan is not an appropriate screening test for endometrial cancer in women without bleeding. The review notes that a national obstetrics and gynaecology society guideline (SOGC) suggests further evaluation when a lining over 11 mm is found without bleeding, or when it looks abnormal in other ways.
Medicines change the picture. The review reports that about half of women taking tamoxifen have a lining over 8 mm, and that the right cut-off for women on HRT without bleeding is less well defined. If you are on either, tell whoever reads your scan, and remember that bleeding still needs checking.
06
A thin lining and fertility: what the evidence can and cannot say
Fertility clinics often mention a thin lining, and the evidence behind it is weaker than the numbers suggest. A 2014 meta-analysis of IVF studies found that a lining of 7 mm or less was uncommon, seen in only 2.4% of cases, and that the chance of a clinical pregnancy was lower in those cycles, 23.3% against 48.1%. Yet overall, thickness had a virtually absent ability to predict who would become pregnant, and the authors concluded that using it to cancel a cycle or stop treatment was not justified.
A later analysis of 25,767 fresh embryo transfers found the live birth rate rose from 15.6% with a lining of 5 mm or less to 33.1% at 10 mm, and suggested 10 mm or more as the best threshold. It was an observational study from one clinic group, and it does not show that making a lining thicker improves results.
The honest summary is that a thin lining is linked to lower chances on average, but no single number reliably predicts your own outcome, and there is no agreed cut-off. It is a reason for a detailed conversation with your fertility specialist, not a verdict.
When to act
Routine — see a doctor
A lining measurement before menopause that your report flags, or a lining over 4 mm found by chance after menopause with no bleeding: discuss it with your doctor, together with your cycle day, symptoms and any medicines.
Same-day — call promptly
Any bleeding or spotting after menopause, even once or a small amount, or bleeding that returns after a normal scan: contact your doctor today to arrange an assessment. Do not wait to see whether it happens again.
Values mentioned in this story
Each one opens a visual guide with its normal range and what moves it — upload a report and we place your own numbers on the same scale.
Sources
- The Role of Transvaginal Ultrasonography in Evaluating the Endometrium of Women With Postmenopausal Bleeding (Committee Opinion 734) — ACOGacog.org
- Suspected cancer: recognition and referral (NG12) — NICEnice.org.uk
- Postmenopausal bleeding — NHSnhs.uk
- Thickened Endometrium: When to Intervene? A Clinical Conundrum (Giri et al., 2021 review)pmc.ncbi.nlm.nih.gov
- Endometrial thickness and pregnancy rates after IVF: a systematic review and meta-analysis (Kasius et al., 2014)pubmed.ncbi.nlm.nih.gov
- Optimal endometrial thickness to maximize live births and minimize pregnancy losses (Gallos et al., 2018)pubmed.ncbi.nlm.nih.gov
Share this story
Curious where your own values stand?
Two minutes from upload to a full visual picture. Free to analyze.